HomeCatalog⚙️ DevOps & InfrastructureNetdata
Screenshot of Netdata website

// screenshot of netdata.cloud ↗

DEVOPS & INFRASTRUCTURE · PRO TIER

Netdatapro

Netdata is real-time, per-second infrastructure monitoring — auto-discovers metrics from your system, applications, containers, and services without configuration. 1-second resolution, beautiful dashboards, ML-powered anomaly detection, all running on a single agent with minimal overhead.

⚙️ DevOps & Infrastructure Min 256 MB RAM Port 19999 (http) Tier pro
// What it is

A closer look.

Netdata is real-time, per-second infrastructure monitoring — auto-discovers metrics from your system, applications, containers, and services without configuration. 1-second resolution, beautiful dashboards, ML-powered anomaly detection, all running on a single agent with minimal overhead.

For sysadmins who want immediate visibility into "what's happening right now" on their servers, Netdata is the fastest-to-value monitoring tool.

// Use cases

What it's for.

Concrete scenarios where teams pick Netdata over the SaaS alternative.

System monitoring

CPU, RAM, disk, network at 1-second resolution
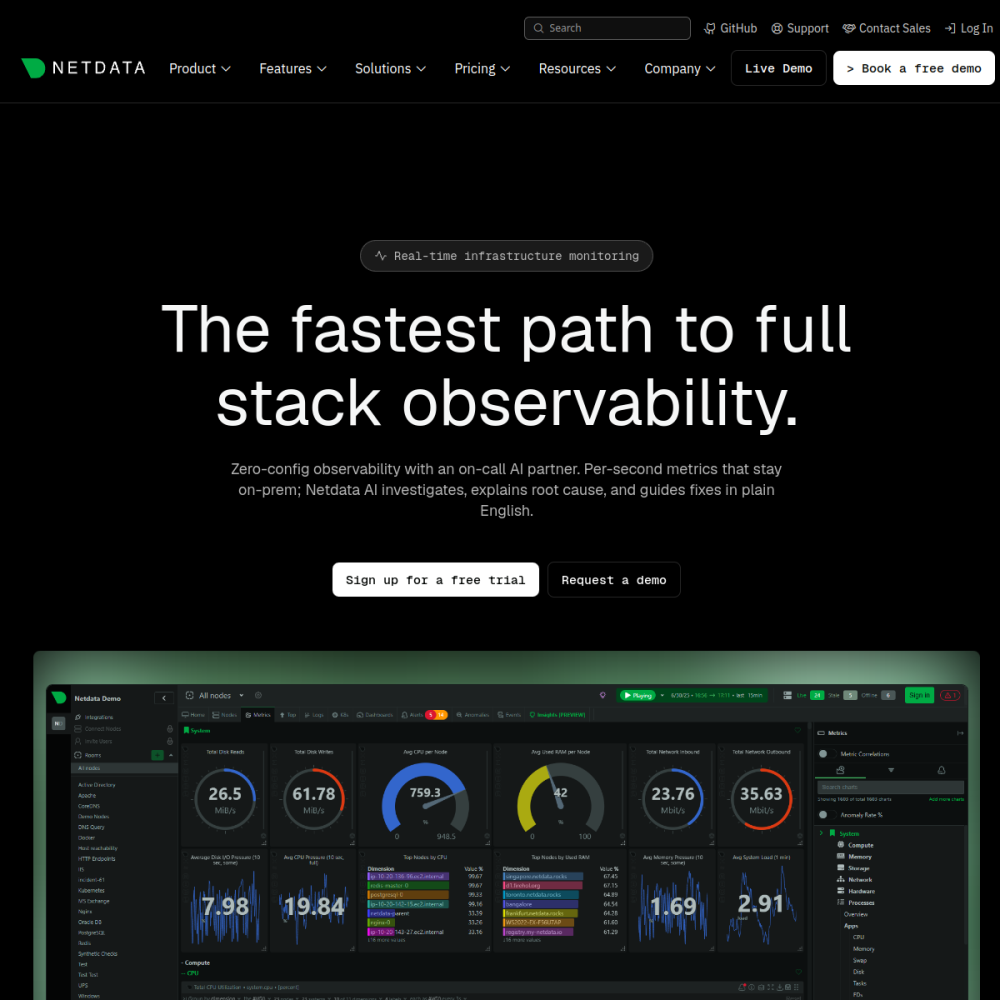
Container monitoring

Docker / Kubernetes auto-discovery

Application monitoring

Nginx, Postgres, Redis, MySQL, MongoDB auto-monitored

Anomaly detection

ML-based outlier detection on metrics

Free fleet monitoring

Netdata Cloud aggregates multiple agents

// Who it's for

Built for these teams.

If your team profile matches one of these, Netdata is a strong fit out of the box.

Profile A

Sysadmins

wanting instant per-server visibility

Profile B

DevOps engineers

monitoring fleet of VPS / containers

Profile C

SREs

triaging incidents with second-level metric resolution

Profile D

Hosting providers

giving customers visibility into VPS health

Profile E

Solo developers

monitoring side-project servers

// Differentiators

Why teams pick Netdata.

When evaluating self-hosted options for this category, here are the dimensions on which Netdata consistently lands above the alternatives.

  • Zero configuration — auto-discovers everything; works immediately
  • GPL-3.0 — fully open
  • 1-second resolution — Prometheus default is 15s; Netdata is 15× more granular
  • Minimal overhead — <1% CPU, <100 MB RAM per agent
  • Built-in dashboards — no Grafana setup required
  • ML anomaly detection — alerts before threshold breaches
// Integrations

Connects to.

The stack you'll plug Netdata into — services, protocols, and adjacent apps in the BluixApps catalog.

Auto-collectors
800+ integrations for apps / services / system
Container
Docker, Kubernetes auto-discovery
Cloud
AWS, GCP, Azure metrics integration
Alerting
Slack, PagerDuty, Telegram, Discord, email, custom webhook
Prometheus
Netdata can export to or consume Prometheus
Netdata Cloud
fleet aggregation across multiple agents
Database backends
local TSDB, or stream to InfluxDB / Prometheus
// Adoption & deployment

Notable users & community

  • 73k+ GitHub stars (top observability project in OSS)
  • Used by Netflix, IBM, Cisco for monitoring at scale
  • Active Discord community
  • Backed by Netdata Inc. with sustainable cloud offering
  • Frequent releases with strong roadmap

What we ship

  • Docker compose: Netdata agent
  • Pinned netdata/netdata:latest (release-tagged)
  • HTTPS via Let's Encrypt
  • Anonymous claim token for Netdata Cloud (optional)
  • Persistent volume for local TSDB
  • Auto-discovery enabled for all standard services
  • Backup hook covers Netdata config + local TSDB
// Tips & operations

Run it properly.

Operational guidance from running this in production — what to do before you scale, what to lock down, what surprises people.

// PERFORMANCE
Use Netdata Cloud for fleet
single-agent view is great; Cloud aggregates multiple
// SECURITY
Disable unused collectors
auto-discovery may pull metrics you don't need; trim for performance
// OPERATIONS
Configure ML carefully
anomaly detection needs baseline; tune sensitivity over time
// RELIABILITY
Alert routing
set up channels per team / severity
// DEPLOYMENT
Persistent local storage
Netdata stores TSDB locally; volume mount for retention
// SCALING
Pair with Loki/Prometheus
Netdata for real-time, Prometheus for long-term retention
256
// min ram (MB)
2
// min disk (GB)
19999
// access port
http
// protocol
pro
// bluixapps tier
19999:19999
// docker image

Project resources

Official sitenetdata.cloud ↗
// Alternatives in DevOps & Infrastructure

Compare with