SQL-based analytics
write queries, visualize results
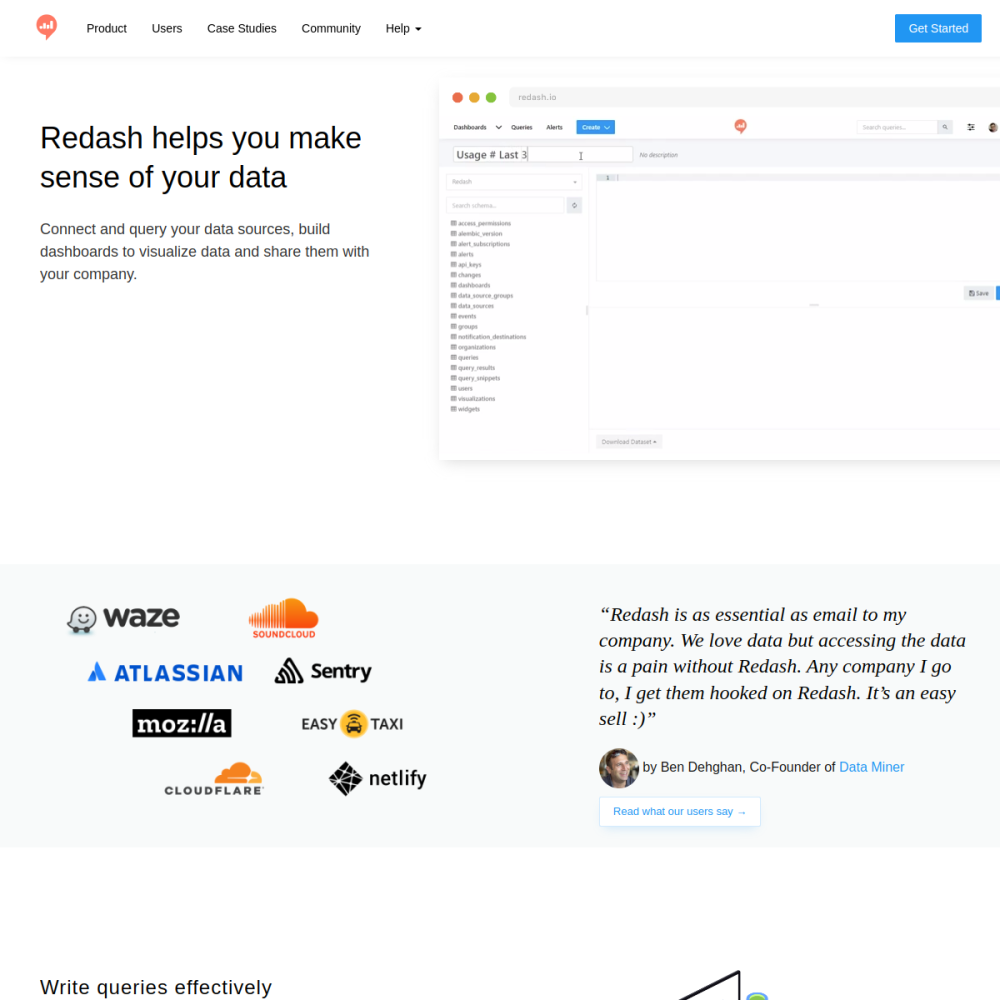
// official site: redash.io ↗
Redash is a BI / dashboard platform focused on SQL-based analytics — write SQL queries, visualize as charts, combine into dashboards. Lower-friction than Metabase / Superset for SQL-savvy teams. BSD-3 licensed core after Databricks acquisition (with some commercial extensions).
Redash is a BI / dashboard platform focused on SQL-based analytics — write SQL queries, visualize as charts, combine into dashboards. Lower-friction than Metabase / Superset for SQL-savvy teams. BSD-3 licensed core after Databricks acquisition (with some commercial extensions).
For data teams whose primary interface is SQL and who want lightweight dashboarding, Redash is the SQL-first choice.
Concrete scenarios where teams pick Redash over the SaaS alternative.
write queries, visualize results
combine visualizations into dashboards
refresh data on intervals
fire on query result thresholds
share publicly or embed in apps
If your team profile matches one of these, Redash is a strong fit out of the box.
comfortable with SQL
building dashboards from production DBs
democratizing data via simple SQL + viz
monitoring pipelines via queries
moving off Tableau / Looker
When evaluating self-hosted options for this category, here are the dimensions on which Redash consistently lands above the alternatives.
The stack you'll plug Redash into — services, protocols, and adjacent apps in the BluixApps catalog.
redash/redash:25 (release-tagged)Operational guidance from running this in production — what to lock down, what surprises people.