LLM debugging
replay traces to understand why responses were wrong
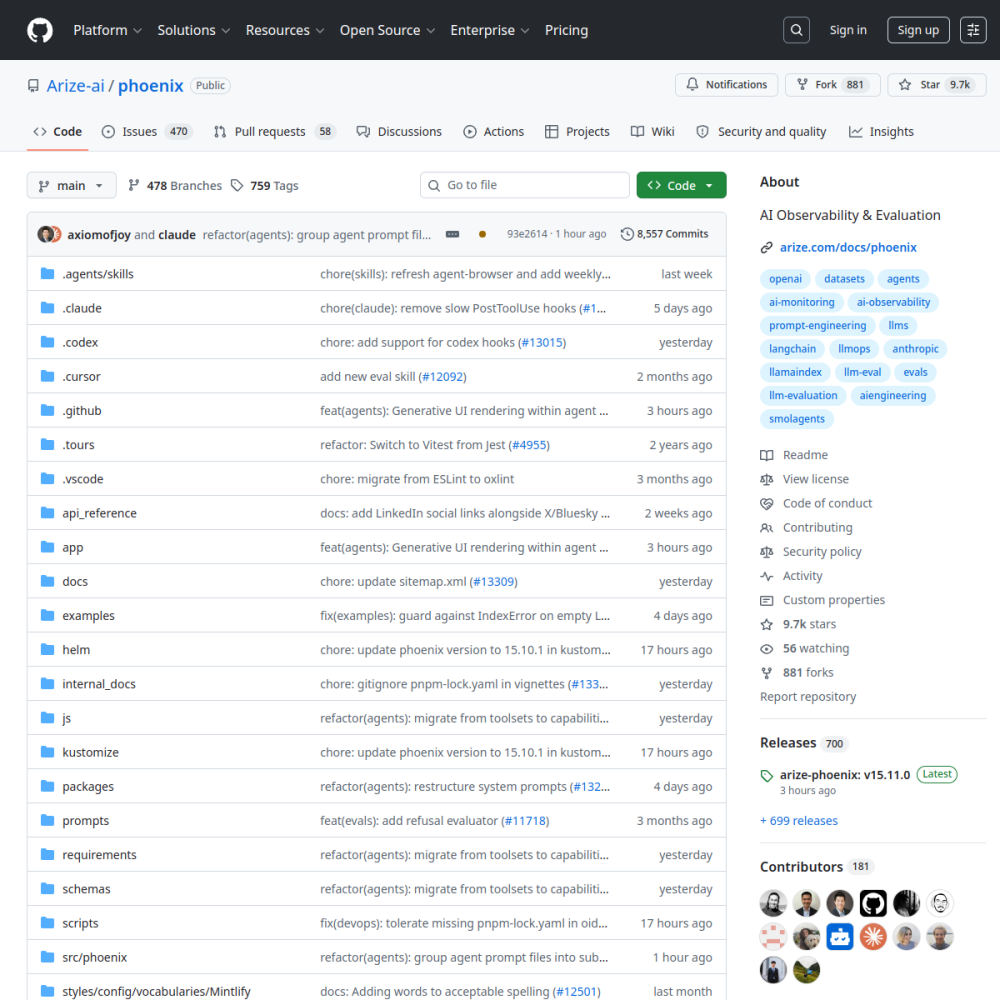
// official site: github.com ↗
Arize Phoenix is an LLM observability and tracing platform — OpenTelemetry-native, captures every LLM call (prompt, response, tokens, latency, cost) and visualizes traces for debugging. Built specifically for AI applications where stack traces don't tell you why the model said something stupid.
Arize Phoenix is an LLM observability and tracing platform — OpenTelemetry-native, captures every LLM call (prompt, response, tokens, latency, cost) and visualizes traces for debugging. Built specifically for AI applications where stack traces don't tell you why the model said something stupid.
It's the closest OSS equivalent to LangSmith and Helicone, designed by Arize AI (a major ML observability company).
Concrete scenarios where teams pick Arize Phoenix over the SaaS alternative.
replay traces to understand why responses were wrong
track token spend per prompt template, per user, per feature
find slow chain steps in agent workflows
run benchmarks on LLM outputs with consistent metrics
compare prompt versions on real traffic
If your team profile matches one of these, Arize Phoenix is a strong fit out of the box.
debugging RAG and agent pipelines in production
standardizing LLM monitoring across products
running prompt experiments with measurable metrics
maintaining LLM call audit trails
providing observability as a service to internal teams
When evaluating self-hosted options for this category, here are the dimensions on which Arize Phoenix consistently lands above the alternatives.
The stack you'll plug Arize Phoenix into — services, protocols, and adjacent apps in the BluixApps catalog.
arizephoenix/phoenix:latest (release-tagged)Operational guidance from running this in production — what to lock down, what surprises people.